AI Answer Visibility Metrics for Marketing Dashboards
Track how AI answers position your brand before traditional search even matters.

B2B buyers now start vendor research on ChatGPT and Perplexity about as often as they start it on Google, and that shift picked up speed fast in 2025. Marketing dashboards built for a click-based web can't see any of it, so most companies are flying blind on a channel that already shapes a real and fast-growing share of buying decisions. The rest of this piece walks through what's actually missing, what to measure instead, and which tools do the job today.
What traditional dashboards cannot see in a zero-click environment
Clicks, impressions, ranked positions: these numbers tell you whether a user reached your page. They say nothing about whether an AI model picked your brand as the answer, and increasingly, being the answer matters more than being a link nobody clicks on.
Here's the part that took some digging to see clearly. When a brand is missing from an AI model's training data or retrieval context, it just doesn't show up in the synthesized answer. There's no dip in a chart, no funnel stage where the drop registers. Historical traffic numbers keep looking normal right up until someone asks why a competitor is suddenly winning every deal in a category the brand thought it owned.
Graph's AI Visibility Report found that most B2B brands in manufacturing and industrial categories are invisible at the exact moment a buyer describes a problem without naming a vendor. That's the earliest stage of the whole buying journey, the point where a mental shortlist gets built. Miss that conversation, and showing up later in a comparison prompt is a much harder climb.
Platform divergence makes it worse. Available visibility data suggests that only a small minority of domains get cited by both ChatGPT and Perplexity for the same prompts. A brand can dominate one surface and be a ghost on another, and a single aggregate share-of-voice number smooths right over that gap like it isn't there at all.
Put these two reports side by side and the real problem isn't a data gap, it's a category gap: most companies don't have a framework for what to measure here, so nothing gets measured. That's the actual blind spot, not a technical limitation of any dashboard tool. Nobody built the category yet.
The four pillars of AI answer visibility measurement
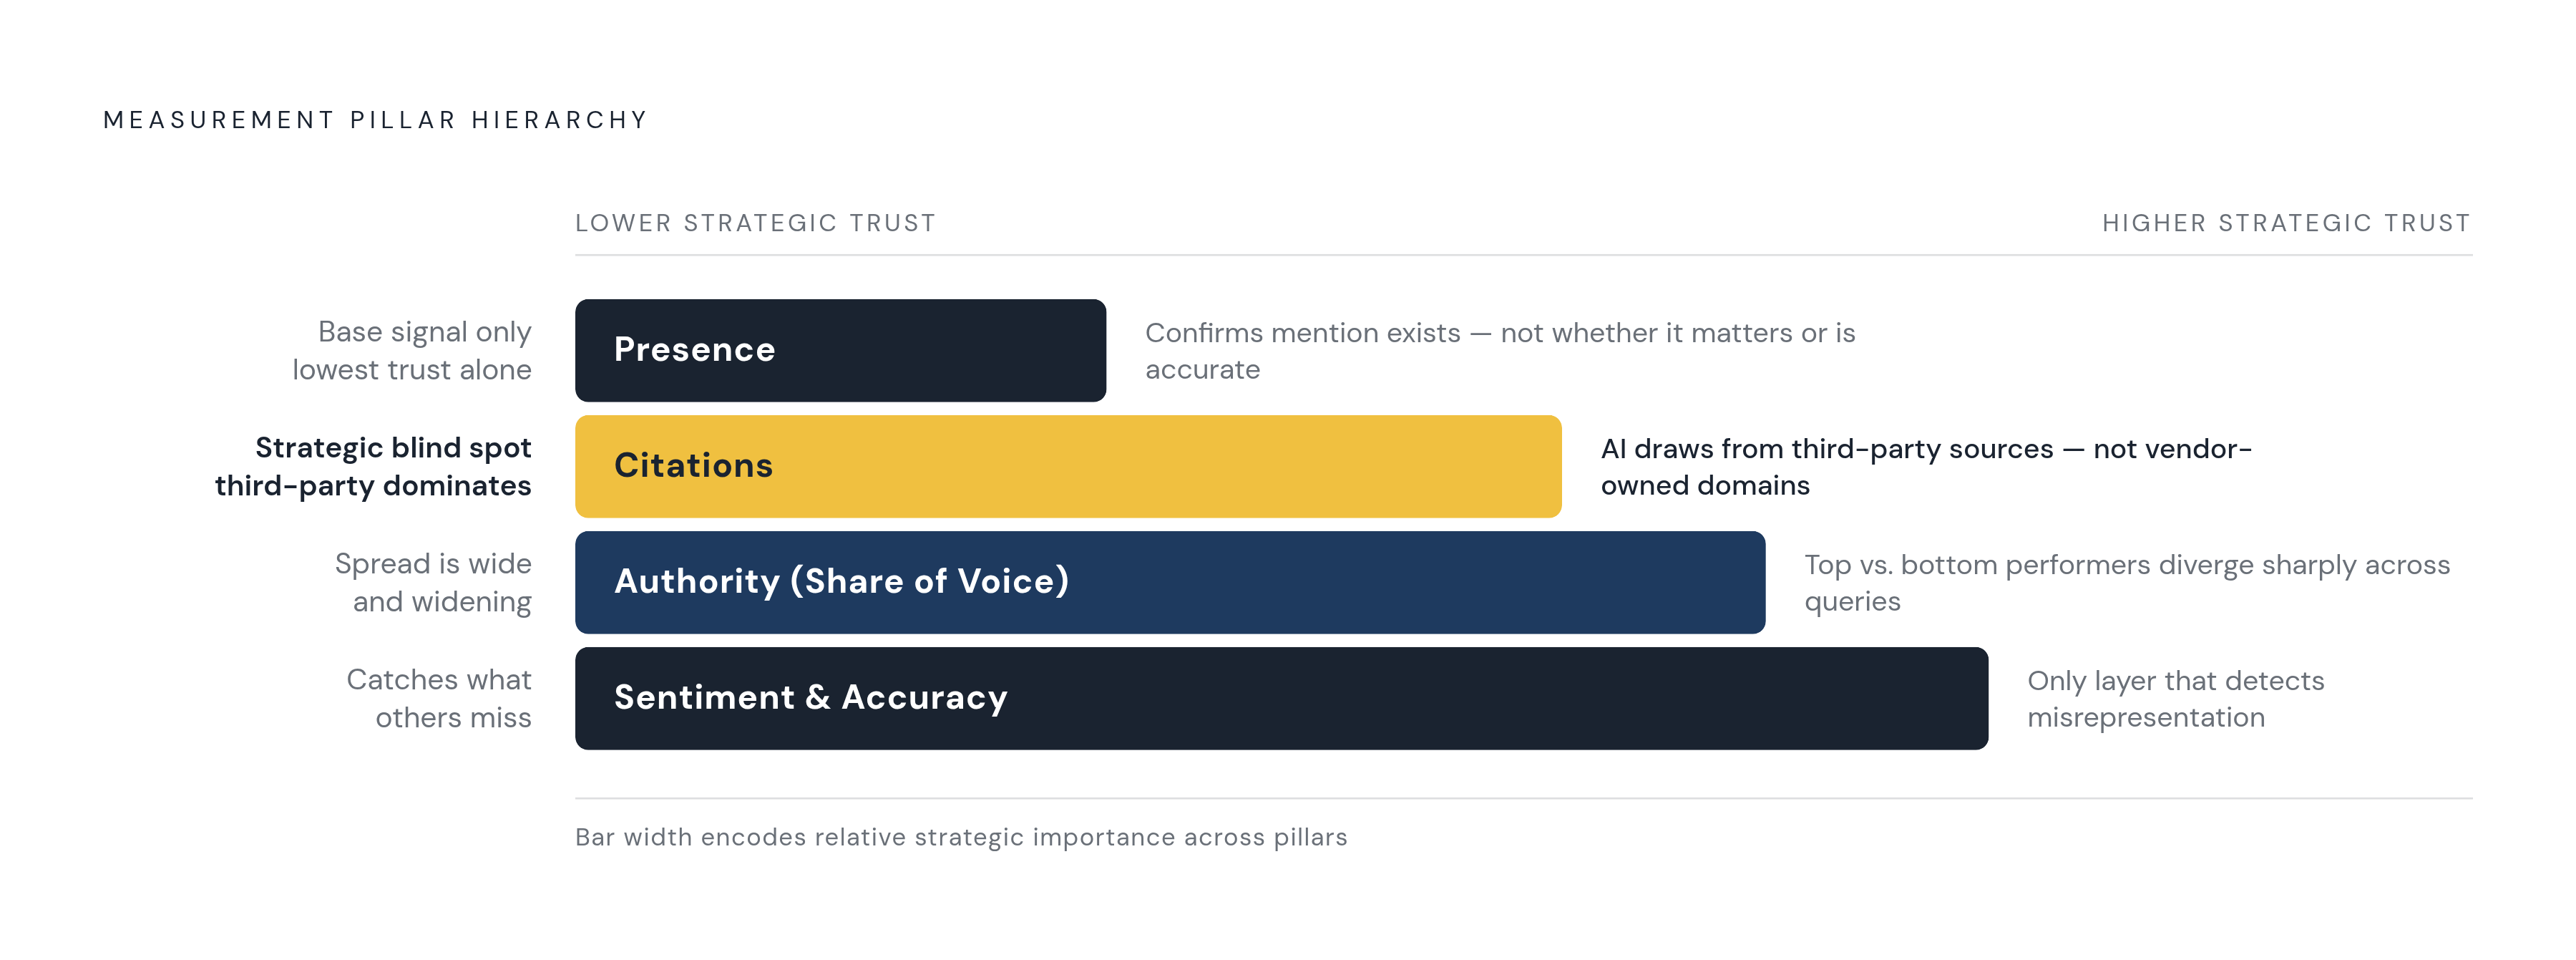
Industry practice is starting to settle around four categories: Presence, Citations, Authority, and Sentiment. Of the four, Presence gets the most attention and deserves the least trust on its own. Treat it as a starting point, not a scoreboard, because a high Presence number can sit right next to a brand that gets recommended by name zero times.
Presence starts with a Visibility Score: the percentage of tracked prompts where a brand shows up at all. Call it the AI-era version of impressions, the top-line number leadership asks about first. Underneath sit five sub-metrics that actually explain the score: citation rate (a URL from the site gets cited), mention rate (the brand name shows up in the answer text), recommendation rate (the AI actively suggests the product, not just mentions it), citation absorption (the content shapes the answer instead of sitting there as an unread footnote), and sentiment classification. Mention rate and recommendation rate get lumped together constantly, and pulling them apart is worth the trouble. Getting named as one of five options is a different outcome than being the one option the model tells the user to buy. Treating those two as the same metric is how a dashboard misleads the people reading it.
Citations run on a spectrum. A passing mention and a formal URL citation reflect two different levels of trust the model places in the content behind them. Observed citation patterns consistently show that AI engines draw heavily from third-party sources rather than vendor-owned domains. That finding rewrites the playbook here. A citation strategy built only around owned content is optimizing for a smaller, shrinking slice of where the model actually looks, and it's the single most common strategic mistake in this whole category.
Share of Voice measures how often a brand comes up relative to competitors across a defined set of industry prompts. The spread between top and bottom performers here is wide and getting wider; the brands leading AI visibility benchmarks tend to hold an outsized share of citations relative to competitors.
Sentiment and Accuracy catches something the other three pillars miss entirely: a brand can appear constantly in AI answers and still get misrepresented. Old reviews, a stale marketplace listing, an abandoned forum thread, a competitor's comparison page dressed up as neutral: any one of these can be the source the model leans on. Negative sentiment in an AI answer usually traces back to a specific third-party source, not to anything the brand itself published. Accuracy tracking asks a related but separate question: is the model describing the product correctly, or has it picked up something that's just wrong?
Why AI referral traffic converts at rates traditional organic cannot match
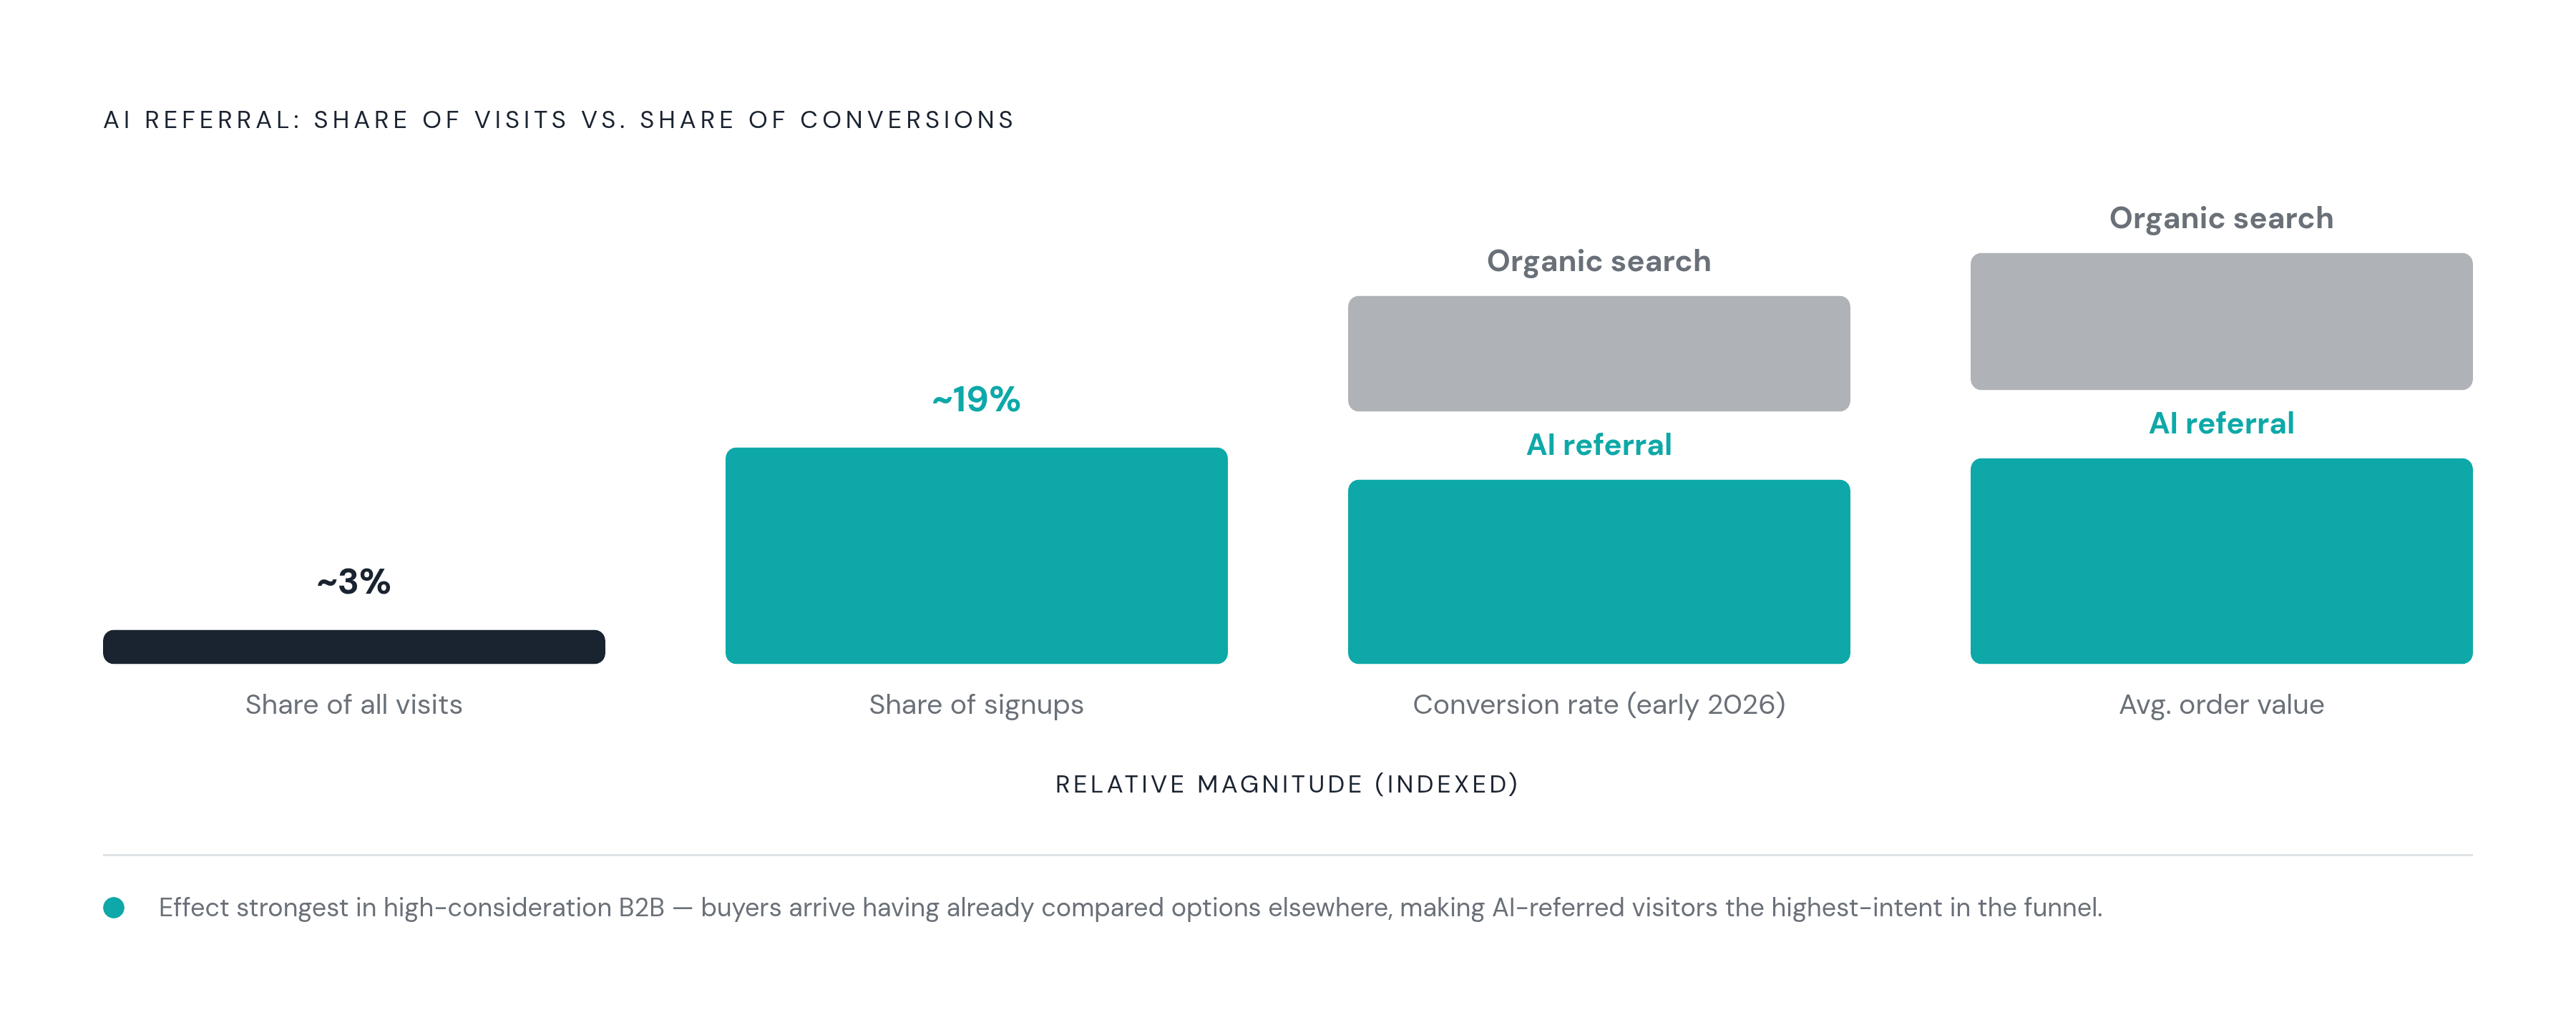
Here's the number that should get a marketing budget approved faster than any visibility score: conversion rate. Multiple independent studies, across different industries and different sample sizes, land on the same pattern. Visitors who arrive through an AI referral convert at a much higher rate than visitors who arrive through traditional organic search.
Observed patterns across multiple sites show AI search making up a small share of total traffic yet driving a disproportionately large share of signups. That's the whole argument for why counting traffic volume alone undersells what's happening here.
Early 2026 data from e-commerce platforms points the same direction: AI-referred sessions converted at a higher rate than organic search and produced higher average order values on top of it. That detail matters: it suggests these buyers arrive already partway through their decision, having done the comparison work somewhere else first.
The premium isn't flat across categories, and treating it that way would be a mistake worth avoiding up front. It shows up strongest in high-consideration B2B purchases, where a buyer genuinely uses ChatGPT or Perplexity to research before ever talking to a salesperson. In low-consideration or impulse categories, the effect is more modest.
One catch worth flagging: not every AI-sourced visit is identifiable in standard analytics. A chunk of it lands in the "direct traffic" bucket, unlabeled and invisible to anyone not specifically looking for it. Dashboards without dedicated AI referral tracking are undercounting AI's contribution to pipeline right now, today, and nobody notices because the number simply doesn't exist yet.
Put plainly: a brand invisible in AI answers is losing the highest-intent visitors in the entire funnel, the ones who already did their homework and showed up ready to buy.
How to build a repeatable prompt methodology before choosing any tool
AI answers are probabilistic by design, which means they're unpredictable on purpose, not by accident. Run the identical prompt on the identical platform twice in one afternoon and two different brands can get recommended, with two different framings and two different shortlists. A single query is a sample size of one. Treating one good answer as proof of visibility is the single most common mistake teams make when they first start looking at this: a screenshot of a favorable ChatGPT response says almost nothing about actual visibility, and building a strategy on top of it is building on sand.
Reliable measurement means a fixed, repeatable set of prompts run on a set schedule, across every platform that matters. Build the library around three clusters. Brand prompts name the company or a named competitor directly. Category prompts describe a problem the way a buyer would at the awareness stage, without naming any vendor at all. Comparison prompts ask for a head-to-head or a shortlist, which is where consideration-stage decisions get made. A few dozen prompts per cluster gives enough coverage to produce a stable signal without turning into a spreadsheet nobody updates past the second week.
Funnel stage changes what each prompt cluster is actually telling you. Category prompts show whether a brand exists in the buyer's mental model before comparison shopping even starts. Comparison prompts show whether it wins once buyers are actively weighing choices. Different questions, different answers; collapsing them into one blended score erases the distinction that made the split worth doing in the first place.
Run every prompt across every major surface: ChatGPT, Perplexity, Google AI Overviews, Google AI Mode, Claude. Platform-level segmentation matters here. An aggregate score blending all five surfaces hides the exact platform where a brand is absent or described wrong, and that's precisely the detail a content team needs in order to fix it.
Cadence matters as much as coverage. A model update, new content entering the retrieval layer, a competitor's fresh case study: any of these can shift the answers overnight. Quarterly is the floor, with more frequent runs after a major content push or product launch. Brands that refresh and test their answer framing on a regular schedule tend to see more consistent AI placement over time. Manual prompting by hand doesn't scale past a handful of queries, and it introduces its own inconsistency on top of the platform's. Multiple runs per prompt, done on a system, sets a floor worth holding to.
The tools currently available for tracking AI answer visibility
The specialist tool category here is young, and it's consolidating fast. Most of the platforms worth naming launched or relaunched in 2025 and 2026, which says something about how new this whole measurement problem actually is. Anyone shopping this category right now should assume the landscape looks different in twelve months, so pick for what a tool tracks today, not for the brand name on it.
Profound built its product specifically for AI search visibility, tracking where, how, and how often a brand gets recommended across the major generative AI tools. Coverage spans a wide set of surfaces, including ChatGPT, Google AI Overviews, Google AI Mode, Gemini, Microsoft Copilot, Meta AI, Grok, and Perplexity. It flags content gaps and surfaces citation opportunities. Entry-level pricing is public; full multi-platform coverage sits behind custom enterprise deals.
Semrush's AI Visibility Toolkit is among the more established options in this space. It includes an AI Visibility Score, prompt research tied to intent data, competitor gap analysis, brand sentiment reporting, and daily prompt tracking. Per-domain pricing is publicly listed, and the underlying dataset draws on a large corpus of prompts pulled from Semrush's broader index.
A handful of other platforms, including Peec.ai, round out the 2026 landscape with different mixes of platform coverage, prompt volume, and sentiment analysis. Before signing anything, check two things: how wide the platform coverage actually goes, and how often the tool refreshes its data. A tool that checks ChatGPT weekly and Perplexity monthly gives skewed visibility, and that gap won't show up until the month a competitor's Perplexity presence quietly overtakes yours.
Native platform features are closing part of the gap without anyone having to buy a specialist tool at all. Native platform analytics features are beginning to close part of the gap without requiring a specialist tool. These handle referral traffic attribution only; prompt-level tracking of brand mention, sentiment, or share of voice stays a separate job that neither tool does.
Broader content platforms, the ones built around production workflows rather than pure measurement, are starting to fold AI visibility into existing content performance views. That fits a team that wants the reporting sitting next to where content actually gets planned, instead of living in a separate tool nobody opens.
How to structure the dashboard so metrics connect to decisions
Two tiers of reporting, built for two different audiences with two different decision cycles. Collapse them into one dashboard and the result is too detailed for leadership and too vague for the content team, which helps neither one.
The operational layer belongs to the marketing team day to day. Core metrics: Visibility Score, share of voice broken out by platform and prompt cluster, citation share, source mention rate, sentiment score, positioning accuracy. Every one of those needs a breakdown by platform, topic, and funnel stage, because a single blended number hides the exact gap a content or PR team could go fix this week. This layer connects straight to real decisions: which topics need new owned content, which third-party sources are quietly pulling the model toward a competitor, where a review site or forum thread is dragging sentiment down.
The executive layer exists to answer three questions leadership actually asks, and only those three: is there a problem, how big is it, and is it getting better? Six indicators cover it: share of answers, third-party mention rate, information correctness, recommendation rate, how many surfaces are being tracked, and how consistent results are across multiple runs. AI referral conversion rate belongs in this layer too, and it's arguably the single most important line on the whole dashboard, not one line among six equals. It's the number that justifies paying for everything sitting underneath it in the operational layer. If a dashboard can only fit one metric above the fold, this is the one; a visibility score with no conversion data attached risks becoming a vanity metric dressed up as a business metric.
This layer only works connected to the rest of the analytics stack. Native analytics can surface referral traffic patterns alongside citation data. Traditional impression and click-through data can then be read alongside answer-engine tracking. A CRM connection maps visibility metrics straight to pipeline and revenue, and skipping that last link is exactly how visibility stays a marketing curiosity instead of becoming a number finance actually takes seriously.
Cadence closes the loop. Weekly or biweekly prompt runs feed the operational layer with enough frequency to catch a model update or a competitor's move before it's old news. Monthly summaries for the executive layer should track trend lines, not single snapshots; given how probabilistic AI answers are, one reading on one day sits closer to noise than signal.
Every metric on this dashboard should map to a lever someone can actually pull: new owned content, a push for better third-party coverage, active review management, a wider prompt library. That's the whole point of running the cycle at all: a next step worth taking, not another number to admire.


